How will the proposed new East London river crossings affect traffic in Shooters Hill? This was the question I looked for answers to in the documentation accompanying Transport for London’s latest consultation on the crossings. As TfL have previously accepted that the road infrastructure south of the Thames is not adequate to serve the proposed new crossings this seems to be an essential question for them to answer.
The documentation includes a Traffic Impact Report: great, I thought, that’s where I’ll find the answer, but no, it turned out to be far more complicated to find what I was looking for.
The first complication is that the report assumes that the proposed Silvertown Tunnel has already been built. It doesn’t explicitly say so: it models the traffic effect of the new crossings compared with a Reference Case, which “reflects the highway network in 2031”. Reading through it quickly becomes clear that the traffic flow changes calculated are the effect of adding the Gallions and Belvedere crossings to a road system which includes the Silvertown Tunnel. Not the change from today’s traffic flows to those after the proposed crossings are developed.
No problem: there was a Silvertown Tunnel consultation recently, which included amongst its archive documents a Traffic Forecasting Report from 2014. This should let me see the changes to traffic as a consequence of the Silvertown Tunnel, I thought, which I can combine with the latest report to see what the total impact of all the proposed new crossings will be.
But again no. The Silvertown report also assumes a reference case which is the traffic in 2021. Why? They don’t seem to say. This reference case is defined as:
Reference case (2021)
6. The reference case represents 2021, and includes growth in population and employment from the 2009 London Plan. Population is expected to increase more rapidly in east and south east London than in other sub-regions.
7. The reference case also includes committed transport schemes. Public transport connectivity across east and southeast London improves because of planned investment including Crossrail. The Woolwich Ferry is assumed to have been enhanced with 30% additional capacity. The reference case does not include the Silvertown Tunnel.
8. From 2012 to 2021 the proportion of travel by car is expected to fall in Greenwich, Newham and Tower Hamlets, but the growth in population and employment result in an increase in total car trips.
Why they think the Woolwich Ferry will have 30% more capacity is also unclear – a footnote in the report just says that “by 2031 Woolwich Ferry would need to either be upgraded at its existing location or replaced with a new crossing”. This upgrade is not a “committed transport scheme” as implied by the extract above. They also assume that the Woolwich Free Ferry will be charged, as would the Blackwall, Silvertown, Gallions Reach and Belvedere Crossings. The charges would be the same as for the Dartford Tunnel at peak times and half that rate at other times. TfL assert that these charges will counteract the “induced traffic effect” where new roads generate new traffic. However their rationale for this assertion is unconvincing and they say it “… is not modelled in the Assessed Case.”
The Silvertown Traffic Forecasting Report also considers in Appendix C the impact of the Gallions and Belvedere crossings on traffic flows. Interestingly it ends up with different results to those presented in the Gallions/Belvedere consultation Traffic Impact Report.
The reports contain a large number of tables, graphs and maps of the traffic modelling results. I’ve extracted four maps to try to give a flavour of the impact of the crossings on our local streets. All four are for the afternoon rush hour traffic:
- The 2021 “Reference Case” from the Silvertown Tunnel Report;
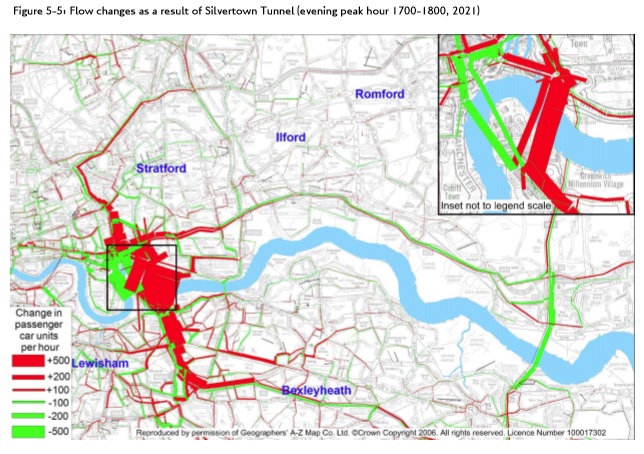
- The impact of the Silvertown Tunnel compared to the reference case from the Silvertown Tunnel Report;
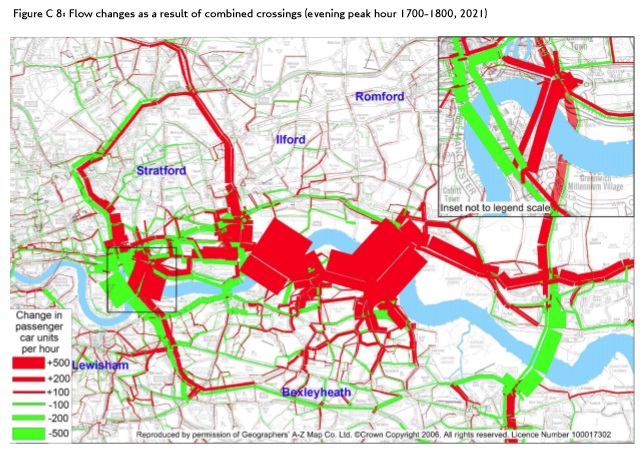
- The impact of the Gallions Reach and Belvedere crossings compared to the reference case and Silvertown Tunel from the Silvertown Tunnel Report;
- The impact of the Gallions Reach and Belvedere crossings compared to the reference case from the Gallions/Belvedere Report.
Red on these maps indicates increased traffic flows and green reduced.
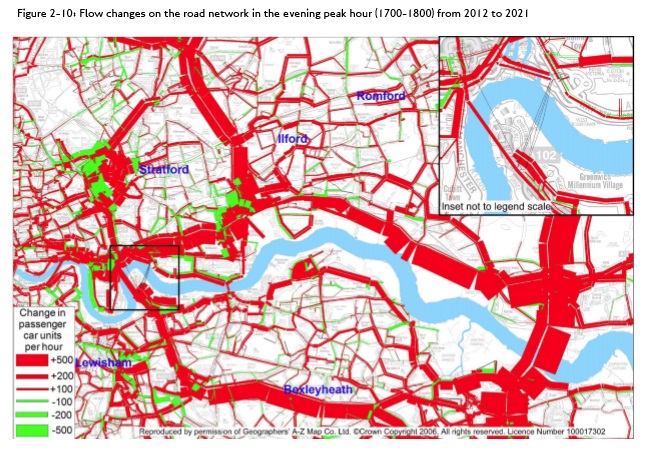
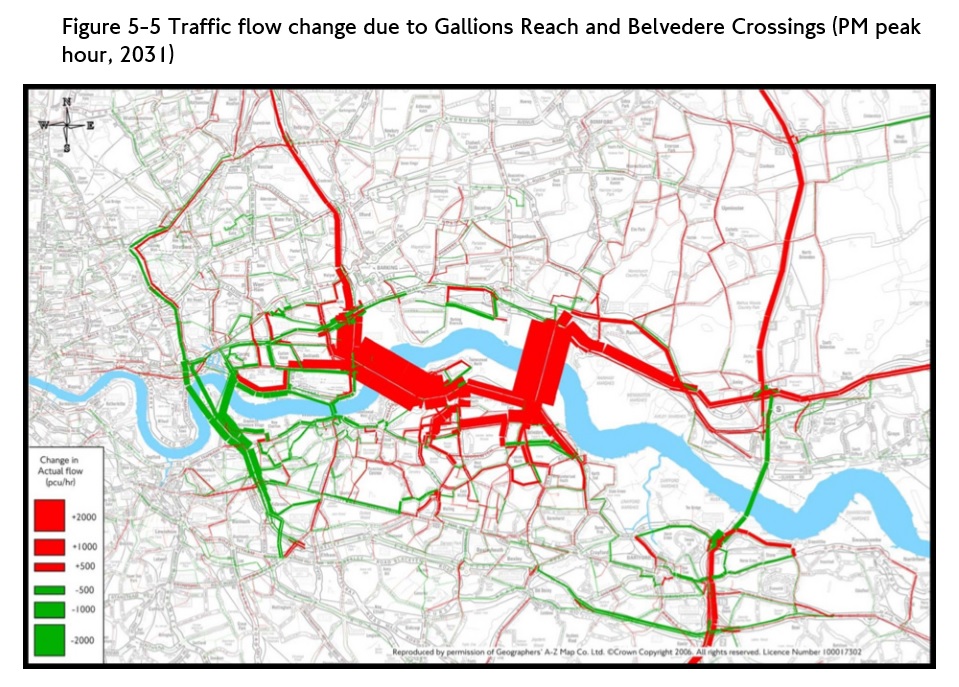
The scale and resolution of the maps make it difficult to work out which local roads suffer traffic increases, but it’s just about possible by zooming in and looking at the shape and orientation of the roads. The red/green bar method of showing traffic changes also tends to obscure rather than illuminate. Anyway, here’s my interpretation of what the modelling is showing.
The reference case, which just reflects population growth and an increase in Woolwich Ferry capacity, already has big increases – 100 cars per hour or more – along Shooters Hill Road, Shrewsbury Lane, Plum Lane and slightly surprisingly Donaldson Road too. The increase along Plumstead Common Road looks even bigger, and also along Kings Highway, Wickham Lane down towards Knee Hill.
Bringing the Silvertown Tunnel into the model there is a decrease in traffic flow along Shrewsbury Lane and Plum Lane, but an increase in Red Lion Lane which runs in a similar direction. Along Shooters Hill and Shooters Hill Road traffic flows increase again, and the route down through Charlton to the tunnel has more traffic, affecting Baker Road and Stadium Road past the hospital then Charlton Park Lane and Cemetery Lane.
In the Silvertown Tunnel report the impact of the additional crossings at Gallions Reach and Belvedere is a very slight reduction of traffic along Shrewsbury Lane, but an increase along Eaglesfield Road to Plum Lane which is unexpected (and unlikely I would have thought), and an increase in Plum Lane itself. Not unexpected are the additional increases in Plumstead Common Road and the route down to the High Street via Griffin Road, nor those from Plumstead Common down Kings Highway to Wickham Lane and Basildon Road and Eynsham Drive. There is lots of red showing big increases from the A2 over towards Gallions Reach and Belvedere, affecting Upper Wickham Lane, Lodge Hill, Okehampton Crescent, Brampton Road and Knee Hill (yet again).
It also predicts that traffic going along the bottom of Herbert Road, through the shops will increase. Can you imagine even more cars trying to negotiate the hazardous route between parked vans and oncoming buses in the rush hour?
The final map, from the current consultation, is similar to the previous one but now there is an increase in traffic along both Shrewsbury Lane and Eaglesfield Road. Other flows appear to be increasing less than in the Silvertown report. In the Gallions Reach/Belvedere report TfL admit to using an earlier version of the traffic model than in the Silvertown report, but don’t really explain why.
The striking feature of all of these maps is the amount of red on them, showing cumulative increases in traffic flows as each crossing is built.
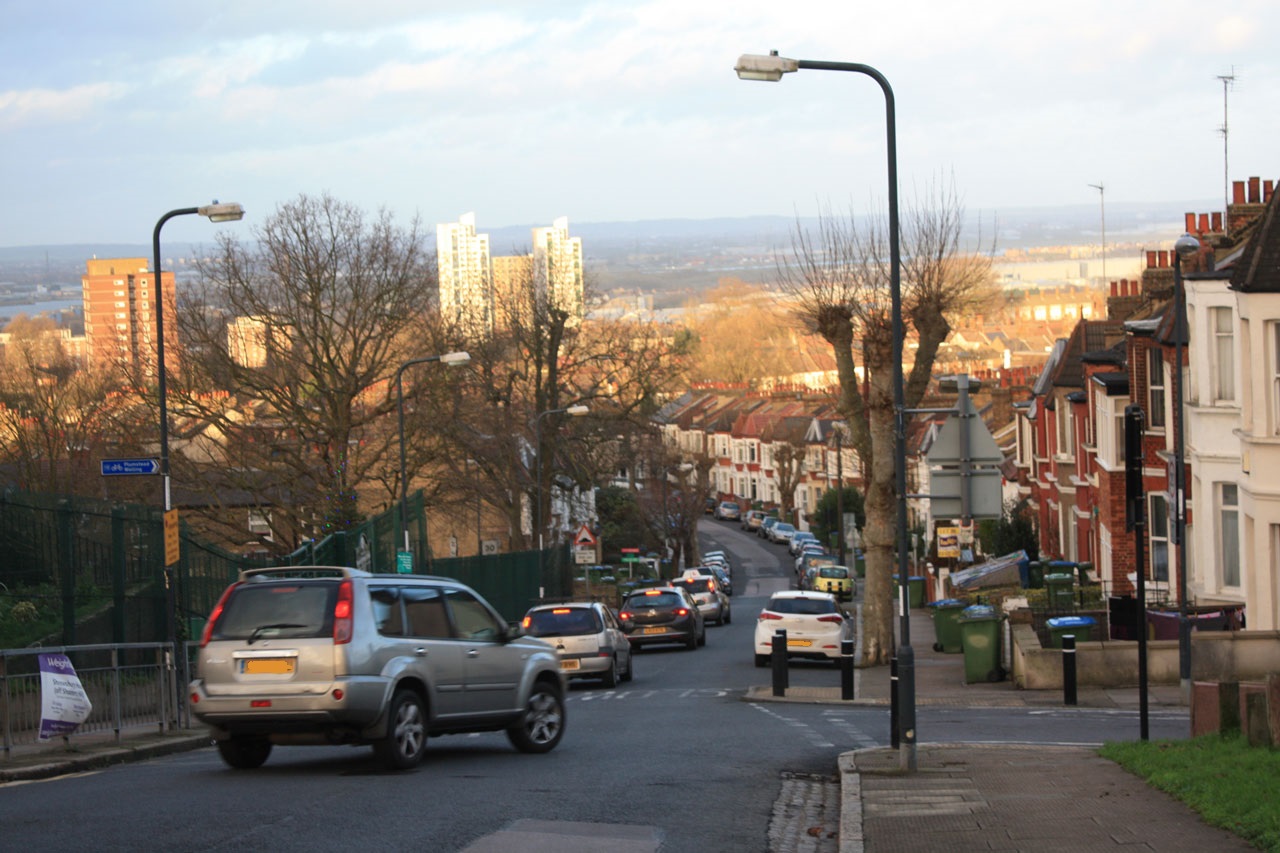
The traffic modelling doesn’t seem to take account of how the roads actually are. For example, that nice straight red line showing increased traffic from Shooters Hill along Shrewsbury Lane and Plum Lane through to Plumstead Common Road. These are residential roads, not suitable to be used as a through route, with speed bumps, and a 20mph limit along Plum Lane. Very often the traffic is single file due to parking on either side of the road. Plum Lane passes close by Plumcroft Primary School. And at the bottom there’s that narrow one way stretch of Plum Lane, making traffic going down the hill turn left and then right along Kirk Lane to get through to Plumstead Common Road. The very sharp turning between Plum Lane and Plumstead Common Road doesn’t exist as far as TfL are concerned.
Similar points could be made about many of the other roads showing increased congestion on TfL’s maps. There are campaigns in Plumstead and Bexley to oppose the crossings, largely because of the devastating impacts on local residential roads.
With increased traffic and increased congestion comes increased pollution, and that means increased damage to people. In 2010 9,416 Londoners died as a result of air pollution, according to research by Kings College, London. Nine thousand four hundred and sixteen people just in London. The health effects of Nitrogen Dioxide, NO2, are a particular concern:
The main effect of breathing in raised levels of nitrogen dioxide is the increased likelihood of respiratory problems. Nitrogen dioxide inflames the lining of the lungs, and it can reduce immunity to lung infections. This can cause problems such as wheezing, coughing, colds, flu and bronchitis.
Increased levels of nitrogen dioxide can have significant impacts on people with asthma because it can cause more frequent and more intense attacks. Children with asthma and older people with heart disease are most at risk.
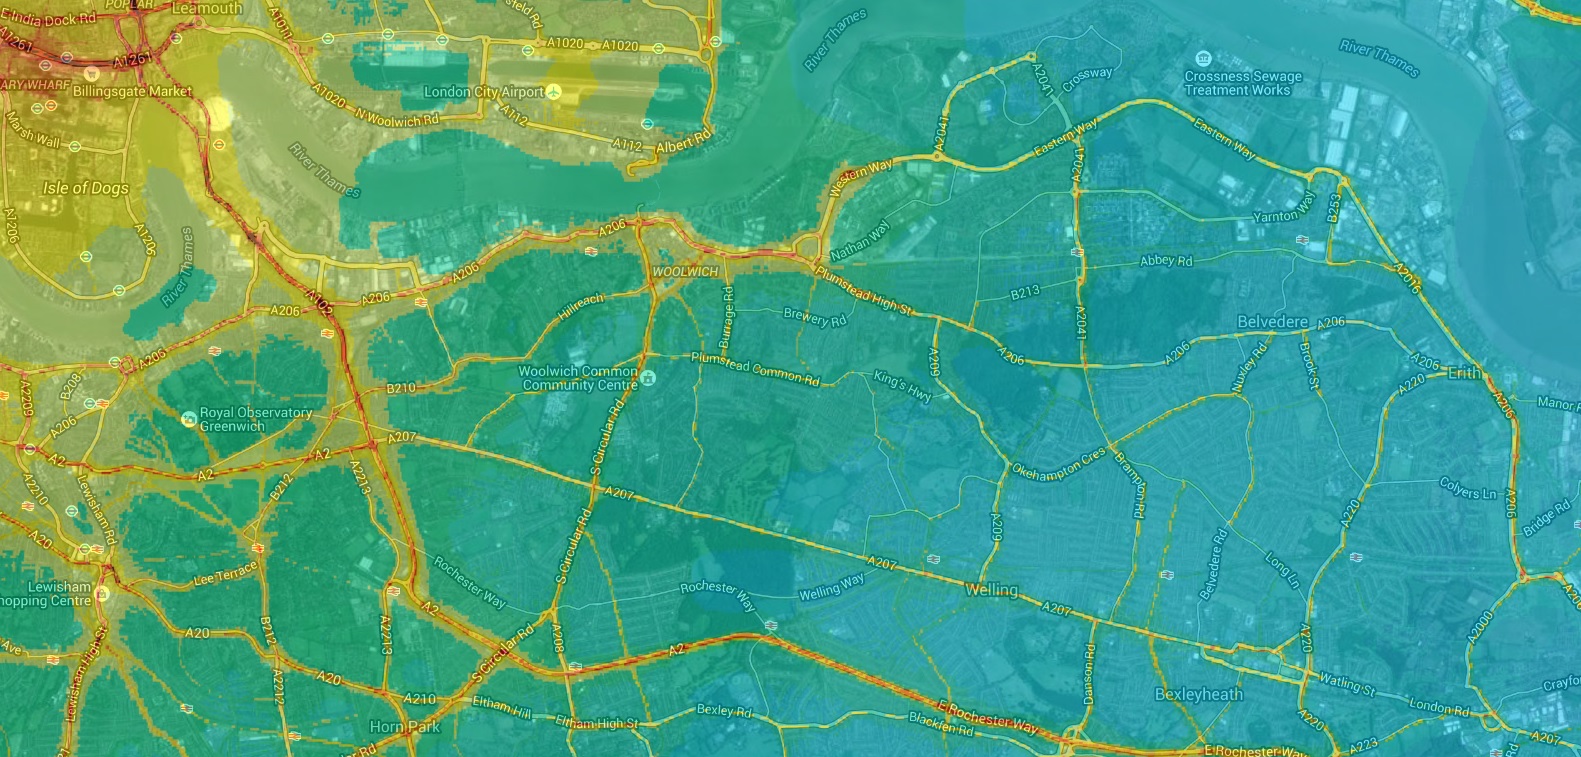
The UK Air Quality Strategy and EU legislation both set an annual average limit for NO2 of 40 µg m-³. In London in 2013 only two local authorities met the limit for NO2, and Greenwich wasn’t one of them. Kings College’s London Air web site has mapped 2010 NO2 levels across London: I’ve included a snippet showing Shooters Hill below. The 40 µg m-³ is shown in yellow on the map, with higher concentrations in deeper shades of orange and red. As well as the major roads, there are high levels along Shrewsbury Lane and down Eglinton Hill, Sandy Hill Road, Burrage Road, Plumstead Common Road and Swingate Lane.
We have until Friday 12th February to respond to this latest consultation. The main themes of this consultation are whether it would be better to build a bridge or dig a tunnel at the two locations, and about how public transport might link to them. We can respond through an online survey, by email to rivercrossings@tfl.gov.uk or by writing to FREEPOST TfL CONSULTATIONS’.
As I’ve said before in posts about a previous consultation and about Oxleas Wood TfL need to say how they will solve the inadequacies of the transport network south of the Thames and demonstrate that new crossings will not cause congestion and pollution in residential roads. Otherwise people will think that they are cynically conspiring to cause chaos and compromise air quality in south-east London so as to be able to justify a new motorway from the A2 to the river through Oxleas Wood, Woodlands Farm and hundreds of Plumstead homes.
It is shocking the number of people living in Plumstead who argue that traffic will be reduced, when even TfL’s models (and answer in Parliament) say otherwise. They are going to answer yes, regardless of the evidence. When I asked about tolling at the TfL roadshow, I was told that, when Dartford Bridge is congested, tolls will be adjusted to send traffic west to Gallions and Silvertown, thus adding to the traffic problems on the lower road and Shooters Hill.